About the Tea Climate Project & Advisory Tool
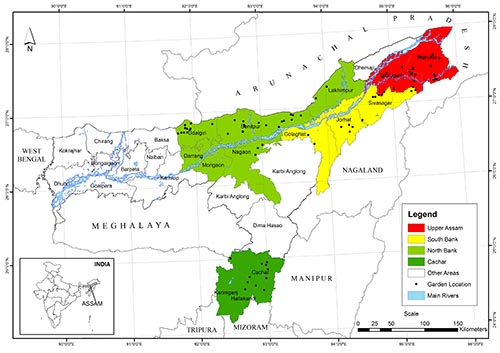
TeaCAT (Tea Climate Advisory Tool) has been developed as a simple web-based platform for providing insights to assist climate advisory services for the tea planter communities. The tool is the first of its kind developed for the tea industry of Northeast India, and provides information on how climate has affected monthly tea crop yield over the period 2004 - 2013 in the four major tea growing regions of Assam. The climate advisories which form part of TeaCAT report statistical associations that various conditions of precipitation and maximum/minimum temperature have had on monthly tea yield.
Climate and tea
Both precipitation and temperature are known to be strongly influential environmental factors which impact tea productivity, both in terms of quantity and quality. Tea is traditionally a rain-fed perennial crop, with varying tolerance thresholds to stagnant water, which may result from excessive precipitation (water logging), and drought due to long dry spells, which may damage the tea leaves by desiccation followed by cessation of active growth (Eden, 1965; Shoubo, 1991). High temperatures (each degree day spent above 30°C) accompanied by no or relatively low precipitation can devastate crop production (Lobell et al., 2011), as temperatures above 30°C may lead to the cessation of active tea growthdue to slowing down of the photosynthesis process (Eden, 1965; Shoubo, 1991), while temperatures greater than 35°C can decrease tea yield (Green, 1970).Temperatures below optimum growth conditions (13°C) can also negatively affect tea yield through foliage damage (Eden, 1965; Shoubo, 1991). TeaCat summarises our results which used a panel-based model to regress various climate variables with tea yield to look at the association between precipitation, temperature and yield.
Data
Daily precipitation time-series records obtained from the Indian Meteorological Department were used in the analysis (2004-2013). The data product is 0.25° x0.25° gridded rainfall (mm) data. This product was developed from daily rainfall records from 6995 rain gauge stations across India by Pai et al. (2014).Daily minimum and maximum temperature (°C) IMD time-series records were obtained.The data product is 1°x1° daily temperature gridded data and was developed from 395 quality controlled stations by Srivastava et al. (2009). The yearly data consist of 365/366 bands for non-leap and leap year respectively. IMD grid time-series data were extracted for point locations to correspond to tea garden locations (locations from which yield time-series records were obtained) for precipitation, maximum temperature and minimum temperature.
Model
To identify the effect of climatic variables on tea productivity a monthly tea yield panel dataset was used. The panel data structure controls for time-invariant unobserved factors that could bias our estimates of the climate effect on tea productivity. Such variables could include soil type, tea cultivar, and plantation management practices. The advantage of using the model is that the country fixed-effects capture all additive differences. It also helps to identify adaptation needs and techniques keeping in view of the current production technology (Schlenkar et. al., 2010). In this research, to observe average monthly weather impacts on tea productivity, the following regression model was used:
ygt = β1Tgt + β2Pgt + β3T * Tgt + β4P * Pgt + cg + εgt
ygt is the log of tea yield in garden g at month t. By taking the natural logarithm of tea yield as the dependent variable the regression coefficients can be interpreted as the percentage change in tea yield with a unit change in the independent variable. This enables comparison of impacts across months. Cg is a tea garden fixed effect accounting for unobserved time-invariant characteristics of tea garden g. εgt is the error term that determines the uncertainty in the model. The model runs for each variable and each month separately. All the garden yield data for each month from 2004-2013 are fed into the same model for a particular variable. Therefore, the model provides a single outcome for the whole region and for a specific climatic variable. The panel-based model was developed to look at monthly variation in yield. The following assumptions are considered for the panel-based regression model:
- The model is considered to be linear
- The variables for precipitation and temperature are considered to assess the climate impacts on tea yield and not the interaction between or among the factors.
- Fixed effects variance between the groups (tea growing regions) is greater than the variance within a group (tea growing region)
A total of 140 conditions of climate variables were used investigating associations with tea yield, these variables captured the effect of intensity of precipitation and temperature, the effect of persistent dry spell and persistent extreme temperatureand the effect of frequency of precipitation and frequency of extreme temperature. Regional model outputs are incorporated into TeaCATas advisories for the tea planter community.
References
Eden, T., (1965),Tea (2nd ed.) London: Longmans
Green, R. (1970). Q,.News letter, tea res. Foundation central Africa, Mlanje, Malawi, 18, 10.
Lobell, D.B. and Burke, M.B. (2010), On the use of statistical models to predict crop responses to climate change, Agricultural and Forest Meteorology, 150, 1443-1452.
Pai, D.S., Sridhar, L., Rajeevan, M., Sreejith, O.P., Satbhai, N.S., Mukhopadyay, B. (2014), Development of a new high spatial resolution (0.25°x0.25°) Long Period (1901-2010) daily gridded rainfall data set over India and its comparison with existing data sets over the region, Mausam, 65(1), 1-18.
Schlenker, W., Lobell, D.B., (2010), Robust negative impacts of climate change on African agriculture, Environ. Res. Lett., 5, 014010
Shoubo, H. (1991), A study on the ecological Climates of some famous tea growing areas in high mountainous regions of China, Chinese Geographical Science, Vol 1(2), 121-128.
Srivastava, A.K., Rajeevan , M., Kshirsagar, S.R. (2009), Development of a high resolution daily gridded temperature data set (1969-2005) for the Indian Region, Atmospheric Science Letters, 10(4), 249-254.
Development Platform
TeaCat is a tool which presents a combination of location-specific land-management advice and recent climatic data to tea-growers in the Assam region. It aims to deliver a rich user experience while targeting a very wide range of web-browsers, both mobile and on the desktop. To minimize bandwidth usage, the maps and charts are rendered server-side as much as possible, thus avoiding any heavy client-side frameworks.
TeaCat lets users specify a location by clicking on a map, selecting a tea garden from a dropdown, or by typing in their latitude and longitude. This functionality is provided by GDAL and Mapserver querying a shapefile to generate static PNG's and imagemaps. It is accessible to any browser which supports imagemaps and Ajax.
The advice and climate data is queried from a PostgreSQL/PostGIS database. The climate charts are generated using the D3 library running on server-side javascript, and served as SVG (a vector graphical format). Though essentially static, the SVG's are enhanced with very lightweight scripts to support eg. hover effects. Browser support for SVG is excellent, with only Internet Explorer 8 and earlier, and native Android 2 and earlier, requiring a fallback (not currently provided, since these browsers are already rare).
Disclaimer
The advisories provided in TeaCAT are based on a subset of regional data and not every tea garden for the region. Outputs reflect a specific temporal period for which the analysis was undertaken. No interaction term between precipitation and temperature was accounted for within the model. As such, caution should be taken when interpreting advisories. Data were checked for quality and consistency as far as possible prior to undertaking the analysis, however, some marginality of error may be apparent in the outputs due to inherent uncertainties of input data.
TRA, the University of Southampton, or any of the project researchers accept no responsibility for subsequent utilisation of the information provided within this TeaCAT platform. Users may do so under their own guidance.